In the past few sections we’ve been learning about evaluating functions: given a particular value of the independent variable, figuring out the resulting value of the dependent variable. You might call this process “plugging in.”
In Chapter 3, we will instead be interested in solving equations: given a particular value of the dependent variable, figuring out what value of the independent variable it came from.
Turns out you can use your evaluating skills to figure out approximate solutions, which are often good enough for our purposes. In this section, we’re about to learn a method called successive approximation, which you might also call “fancy guess-and-check.”
Sometimes it’s hard to get started with the method of successive approximation because you need to make an initial guess. One good way to produce an initial guess is to start with hilariously bad guesses.
In Section 2.3, we looked at how many feet it takes for a Cadillac Escalade to stop when it is traveling at a certain speed. Suppose that it took the car 172 feet to stop. How fast was the car going? Let’s make some bad guesses without even looking at the equation.
Now that we’ve made some hilariously bad guesses, we can use them to come up with a better guess. The real speed is somewhere in between your hilariously low guess and your hilariously high guess. What do you think is a more reasonable guess?
Which country on Earth has the most people? If you guess China and India, in that order, you’d be right. And by a lot compared to other countries. A very distant third is the United States, with several countries close on our heels. Here are the population and growth rates estimates made in 2024.
India’s population is growing fastest of these top three, so let’s take a closer look. In the exercises you can explore China and other countries. Let’s tackle this question: when is India’s population projected to pass 1.6 billion?
Now that we’ve made some hilariously bad guesses, we can use them to come up with a better guess. The real year is somewhere in between your hilariously low guess and your hilariously high guess. What do you think is a more reasonable guess?
In order to check our guesses, we’ll start by writing an equation. The variables are
\begin{align*}
P \amp= \text{ population of India (billion people) } \sim \text{ dep} \\
Y \amp= \text{ time (years since 2024) } \sim \text{ indep}
\end{align*}
Since there is a fixed percentage growth, or at least that’s what we’re assuming, the population grows exponentially. The template for an exponential equation is
We want to know when India’s population will pass 1.6 billion people. That means we are looking for the value of \(Y\) that corresponds to \(P=1.6\text{.}\) That answer is called the solution of our equation.
When we are solving an equation, this means we know a value of the dependent variable (an output) and we want to figure out the corresponding value of the independent variable (the input) that produced it.
When we are evaluating a function, this means we know a value of the independent variable (an input) and we want to figure out the corresponding value of the dependent variable (the output).
Since we can easily check and see if any number is a solution, one way to find the solution is to guess and check. Let’s try that to determine when India’s population will pass 1.6 billion people. Since we’re not sure where to start, let’s see what the equation projects for 2025, when \(Y=1\text{.}\)
This is going slowly. We would really like to find a point at which the equation gives us more than 1.6 billion. Then we can work backwards from there to narrow things down. How about 50 years?
Now that we’ve made a few bad guesses, let’s summarize what we have so far in a table. Notice how we’ve added a third row to keep track of our progress for our goal.
We know the solution is between 10 and 50 years, and it seems closer to 10, so let’s guess 20 years. In 20 years, the population should be around 1.626 billion. Where’s that 1.626 from? Just our equation again. It would be good practice for you to evaluate at \(Y=20\) to check.
The 10 year estimate is too low and the 20 year estimate is too high. That means the solution is between 10 years and 20 years, so let’s split the difference and guess 15 years which gives 1.465 billion. (Check again, for practice.) Ooooh, we’re getting close. The population should pass 1.6 billion some time between 15 and 20 years, and likely closer to 15 so let’s guess 17 years. Estimate is 1.504 billion. Would 16 years have been enough? That gives 1.484 billion, not quite enough. Let’s add these numbers to our table.
It’s good practice to check that when you evaluate, and then round appropriately, you get the same numbers we’ve written down in the textbook. Remember, our equation is
\begin{equation*}
P = 1.049 \ast 1.0072^Y
\end{equation*}
According to our equation, the population of the India should pass 1.6 billion after 17 years, which would be in the year 2028. By the way, it works to add the year and number.
\begin{equation*}
2024 + 17 \text{ years } = 2041
\end{equation*}
It’s always a good idea to check our work using multiple different methods. Since we’ve used a bunch of numerical calculations so far, let’s check our answer using the graph.
It looks like 1.6 billion corresponds to just before the unlabeled gridline halfway between 15 and 20. That line would be 17.5, so the answer of 17 (which was year 2028) looks perfect.
The strategy we used to find the solution of our equation is successive approximation. Essentially it’s just the guess and check method, but it’s called “successive” because we’re trying to get a closer guess each time — we’re using information about our old guesses to help us make better new guesses. Typically once we have a value that’s too big and one that’s too small, we guess a value in between (for example, their average). This sort of splitting the difference method of guessing is a rough version of the bisection method. Now you know.
You might be surprised that you’re supposed to guess the solution at this point in the course. I mean, in the beginning of the course we didn’t have equations, just tables and graphs, and so guessing was all we had to work with. But now we have actual equations, right? In previous courses your instructor or textbook might have emphasized getting the “exact” solution.
Here’s why it’s different in this course. First, in almost every story in this book the numbers in the problem are approximations, or at least rounded off. If you start with approximations, no matter how exact your mathematics is, the solutions will still be approximate. Second, even if our numbers started out precisely exact, chances are that the equation is only approximating reality. Do we really know what the population growth rate will be in India over the next twenty years? And, if the equation is just approximate, then no matter how exact the numbers or the mathematics, the solution will again still be approximate. Last, and this is good news - we really just want approximations. Do you really need to know that a sandwich has 427.2889 calories? Isn’t 430 calories close enough? (Sound familiar? These ideas were discussed in more detail in Prelude: Approximation & rounding.)
In previous mathematics courses you may have seen ways to solve equations “exactly,” and we will talk about those methods in the next chapters of this text. It is true that successive approximation can take a long time and, because of that, is a bit annoying. Solving techniques we’ll learn later are much, much quicker.
There are two important reasons for using successive approximations, even if you know quicker solving techniques. First, the method of successive approximations works in most situations for any type of equation. Solving methods that we will see later on just work for one type of an equation or another - one technique for linear equations, a different technique for exponential equations, etc. That’s a lot of different methods to know. Second, even if you’re going to use a formal equation-solving technique to solve a problem it’s a good habit to guess-and-check a bit first to make sure your solution is reasonable. It is easy to make mistakes when using those formal techniques. Remember,
Suppose the gas tank of a car is designed to hold enough fuel to drive 350 miles.
Aside
(That’s fairly average.) A hybrid car with fuel efficiency of 50 miles per gallon (mpg) would only need a 7 gallon gas tank, but a recreational vehicle that gets only 10 mpg would need a 35 gallon gas tank.
Monty hopes to grow orchids but they are fragile plants.
Aside
He will consider his greenhouse a success if at least nine of the ten orchids survive. Assuming the orchids each survive at rate \(S\text{,}\) the probability his greenhouse is a success, \(P\text{,}\) is given by
What quality of orchids would Monty need to have probability \(P\ge 0.8\) of a successful greenhouse? Report your answer accurate to two decimal places.
What quality of orchids would Monty need to have probability \(P\ge 0.95\) of a successful greenhouse? Report your answer accurate to three decimal places.
After China, India, and the United States, the next five most populous countries (in 2024) are Indonesia, Brazil, Pakistan, Nigeria, and Bangladesh.
Aside
Their projected growth rates and corresponding equation are listed below. Here \(Q\) is the population measured in millions and \(T\) is time measured in years since 2024.
The company decided to declare bankruptcy when sales fell below $20 million. In what year was that? Show how to use successive approximations to estimate the answer to the nearest year.
An analyst had suggested that they close down shop earlier, once sales were below $50 million. In what year did sales fall that low? Again, use successive approximation.
Use successive approximation to figure out what thickness glass should be used to let through less than 10% of the light. Display your work in a table.
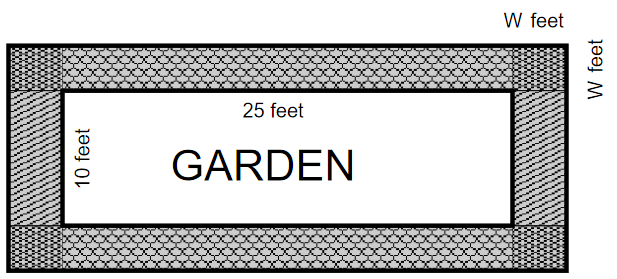
What was once an abandoned lot down the block is now a thriving 10′\(\times\)25′ vegetable and berry garden for the neighborhood. One neighbor volunteered to donate gravel to make a path around the garden. The path will be 3 inches deep and the same width all around. The amount of gravel they need (\(G\) cubic feet) is given by the equation